Project #10 Translation Device
Description
My translation device is to visualize air pollution, people can search for a place with coordinates to see the air pollution situation there. I chose to reference the third feminist data principal: On Rational, Scientific, Objective Viewpoints from Mythical, Imaginary, Impossible Standpoints, which is to elevate emotion and embodiment, and value multiple forms of knowledge, including the knowledge that comes from people as living, feeling bodies in the world. Air pollution is an important topic we always hear about but can't always see with our own eyes, I think this feminist data prinple is suitable to apply to this issue as visualizing the air pollution data can make it easier to grasp and more compelling.
Design Process
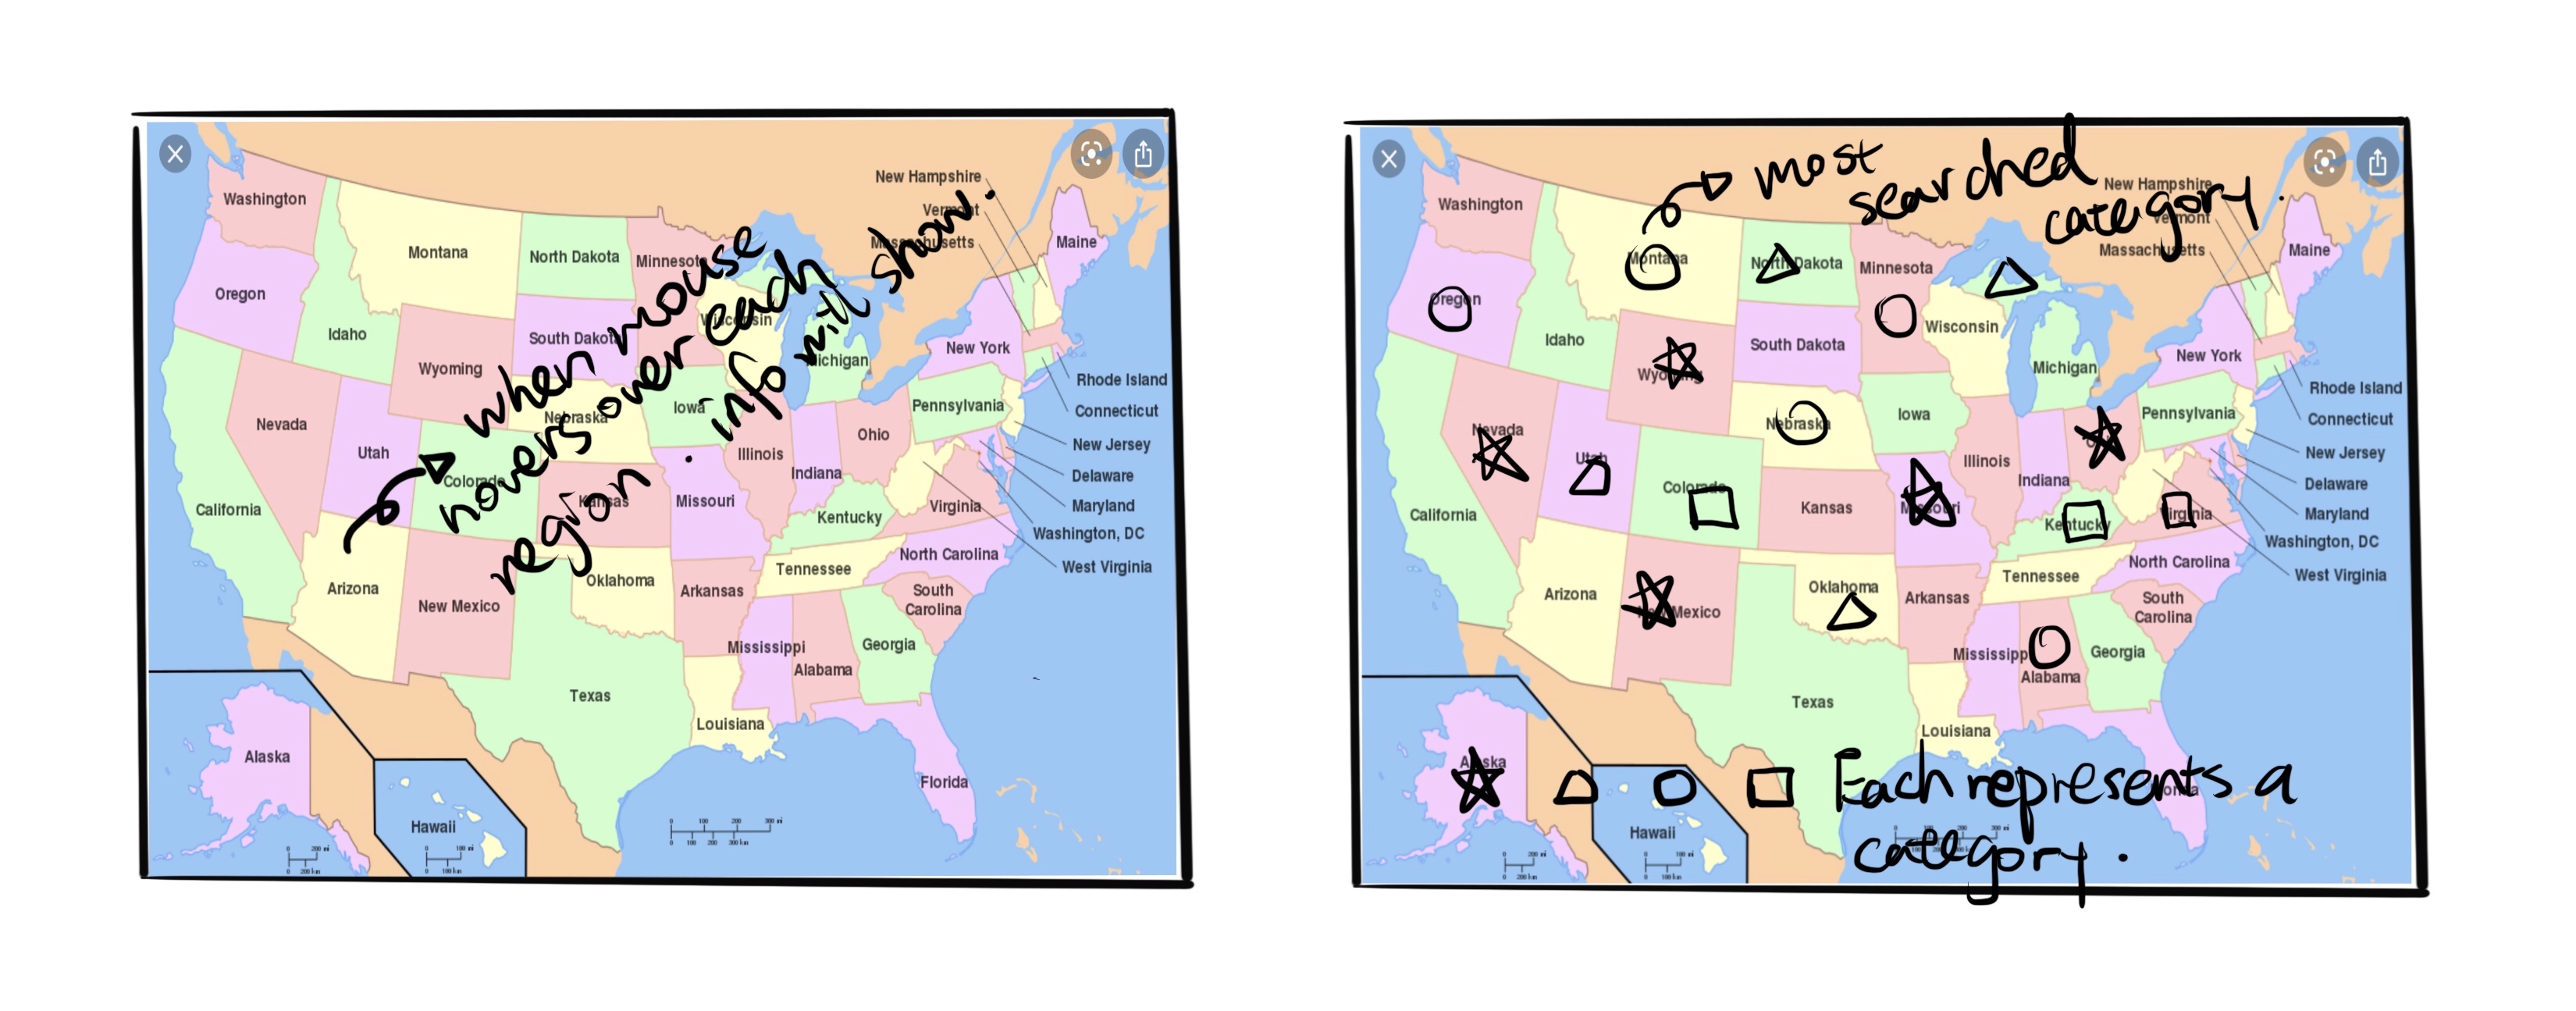
My original idea was to work with the youtube API to visualize the most watched category of video in different regions. However I was having a hard time working with it so I decided to change direction.
API link
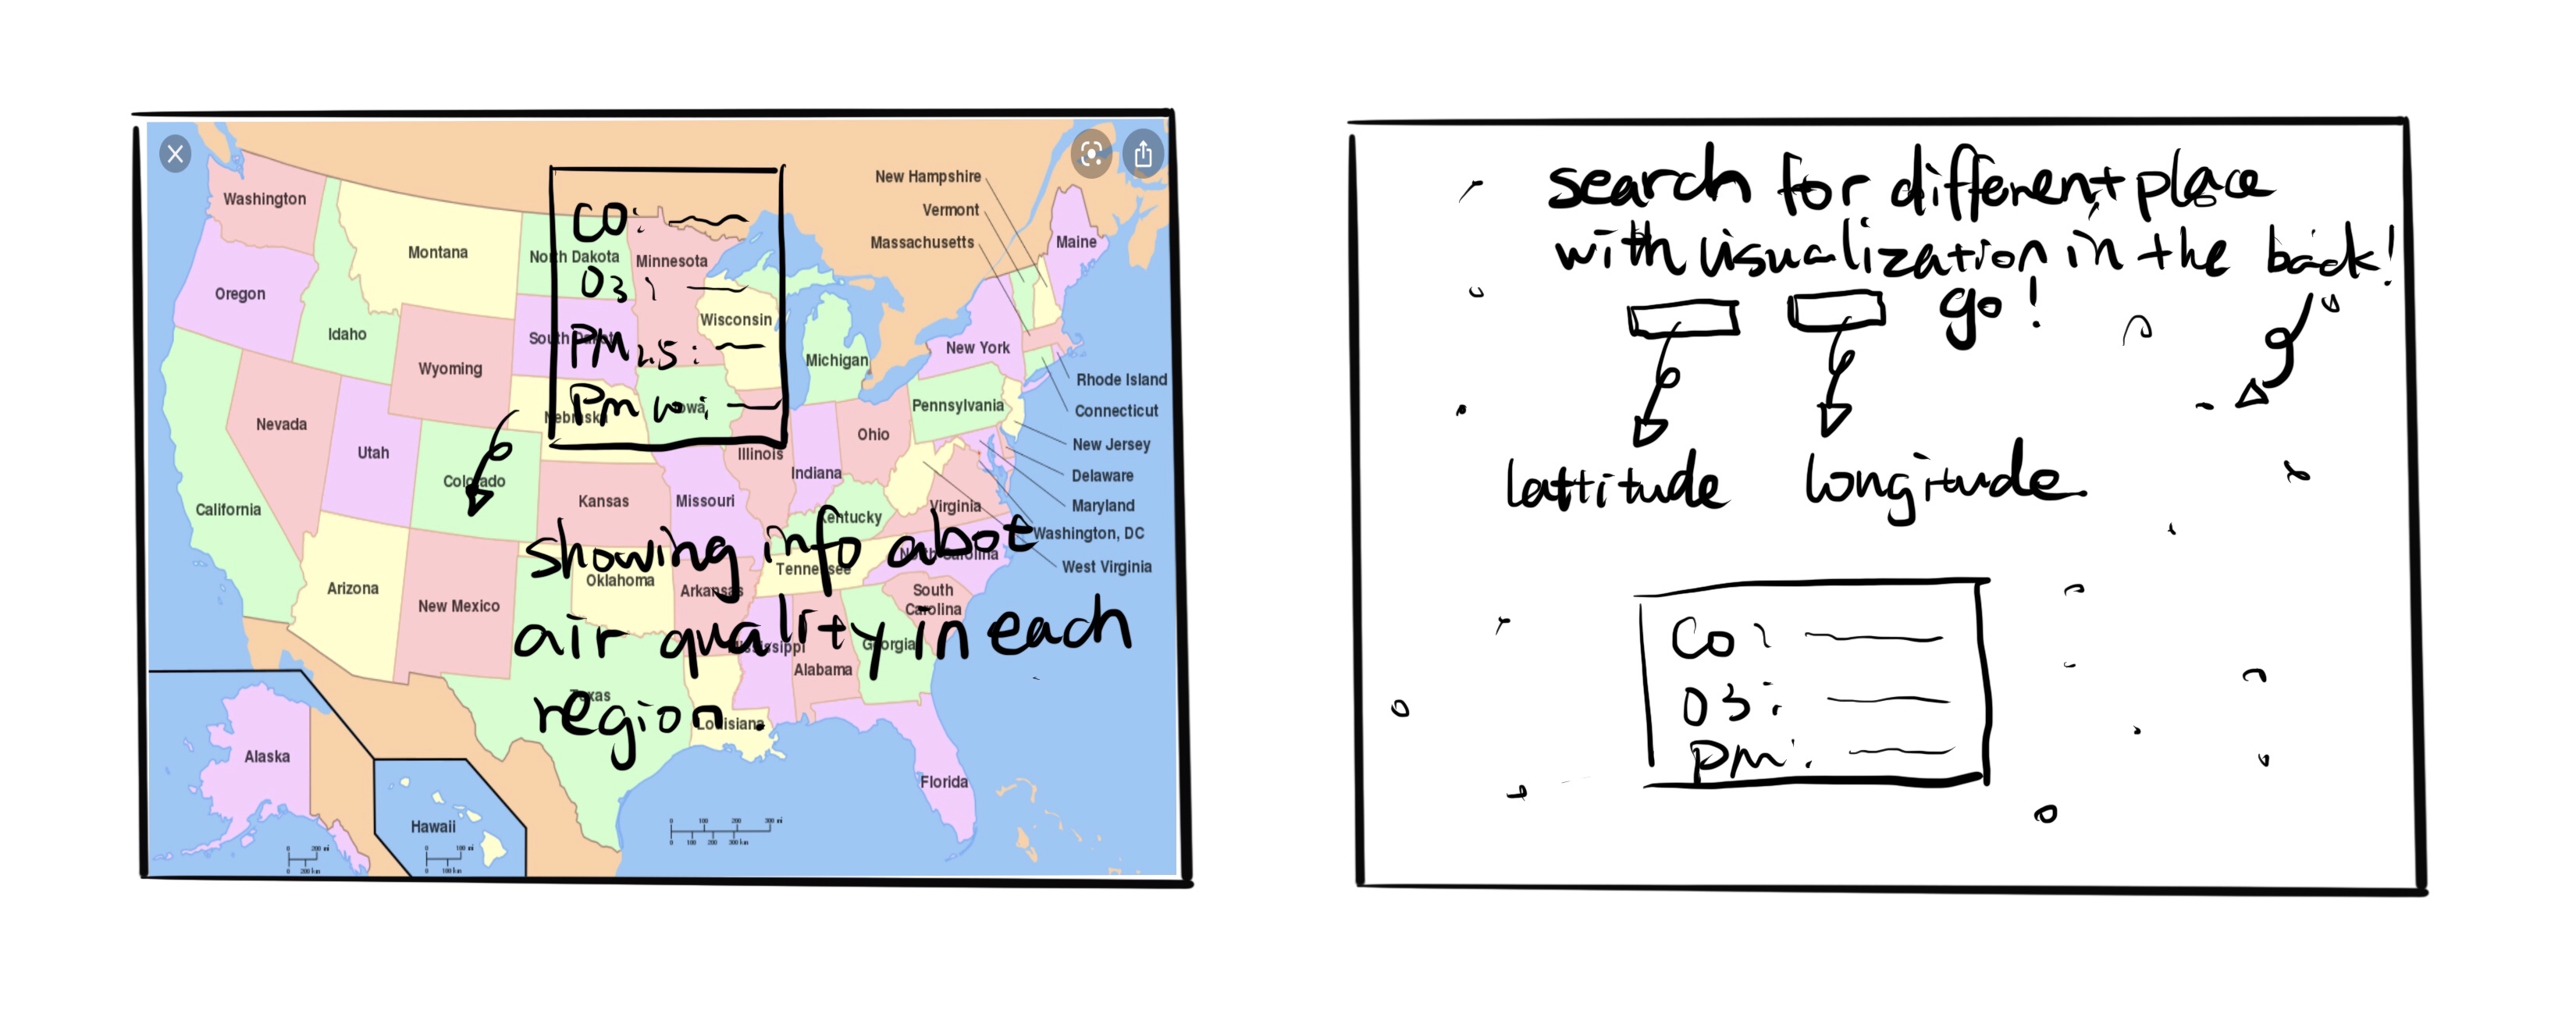
After searching for a while, I decided to work with the air pollution API from OpenWeatherMap. My orginal idea was to visualize the data on a map like what I imagine for the Youtube API, but after some thinking I decided to use my second idea to have the viewer search for the place they want to see because it allows more room for visualization and the infomation would be less overwhelming, which is more suitable for my chosen reference of feminist data. This API allows me to extract current air pollution data for any coordinates on the globe. I used ellipses of different size and color to visualize the amount of Carbon monoxide (CO), Ozone (O3), and particulates (PM2.5 and PM10) in the air, and the viewer is able to type in the latitude and longitude information of a place to see a visualization of the current air pollution there. I'm currently having some trouble pulling that information from the API so I'm still working on the visuals. More details about the visuals coming.
Reflection
This is a challenging assignment. It took me a while to just understand and figure out how to work with an API. It also took me a long time finding an API that works well and also allows me to create something that responds to one of the feminist data principles, but overall I really enjoyed the process of learning to use API and incorporate it in my sketch, I think it would allow me to do a lot more with coding in the future. I was responding to the third principle of the feminist data. I think turning the air pollution data into visulization is able to elevate emotion and embodiment like what the principle has described and make the data easier to grasp and remember, as people are naturally more drawn to visual elements than plain texts and numbers. Although I think I can work on the visual elements a bit more.